Learning how to measure the success of your videos is key to understanding what content resonates best with your audience. Whether you are already a user of Viewed or considering signing up for our platform to create video email marketing campaigns, this tutorial will be very useful to you.
Our statistics provide you with valuable insights that will help you refine your tactics and achieve better results. In this guide, we will show you how to access your statistics dashboards and the relevant information you can obtain from each report.
Furthermore, at the end of this tutorial, we will introduce our latest update, which allows you to compare the results of your videos. Keep reading to find out more!
1. Advantages of Viewed Statistics
When it comes to evaluating the performance of your email marketing campaigns, statistics are of vital importance. Viewed offers a unique advantage by providing video marketing data that focuses on the specific performance of each video sent to your audience.
Unlike traditional email marketing platforms that analyze the overall success of a campaign, our tool allows you to assess the effectiveness of the multimedia content included in your emails. This gives you a clearer and more detailed perspective on how your audience interacts with your videos.
By contrasting the information from our statistics modules with your email metrics, you can make more informed and precise decisions. You can identify which videos have generated more interest and engagement from your audience and adjust your strategy accordingly.
Furthermore, another notable advantage is that if you are a PRO user, you have the ability to define the time period you want to analyze and download the report in .csv format.
2. Reports on the Performance of Your Videos
The reports available in our statistics suites provide valuable insights to evaluate the performance of your videos, understand your audience's behavior, and make strategic decisions to enhance your content.
Los informes que puedes encontrar en nuestras suites de estadísticas te brindan insights valiosos para evaluar el rendimiento de tus vídeos, comprender el comportamiento de tu audiencia y tomar decisiones estratégicas para mejorar tu contenido.
2.1 Views
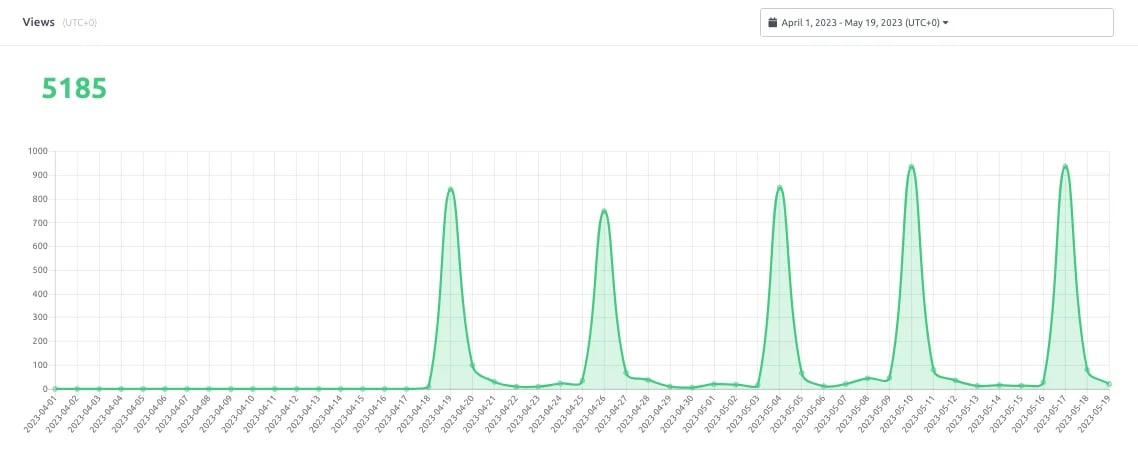
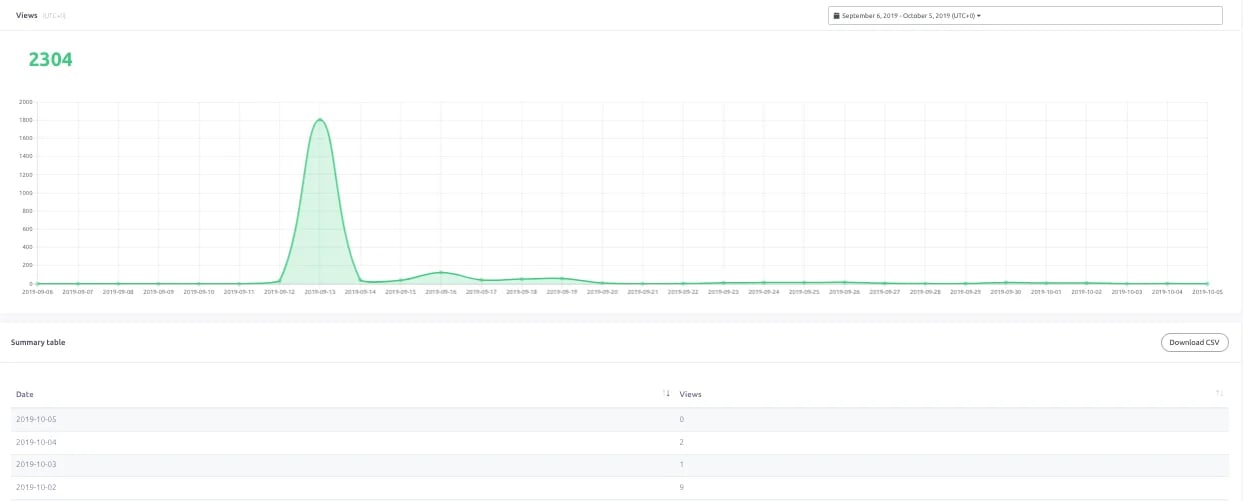
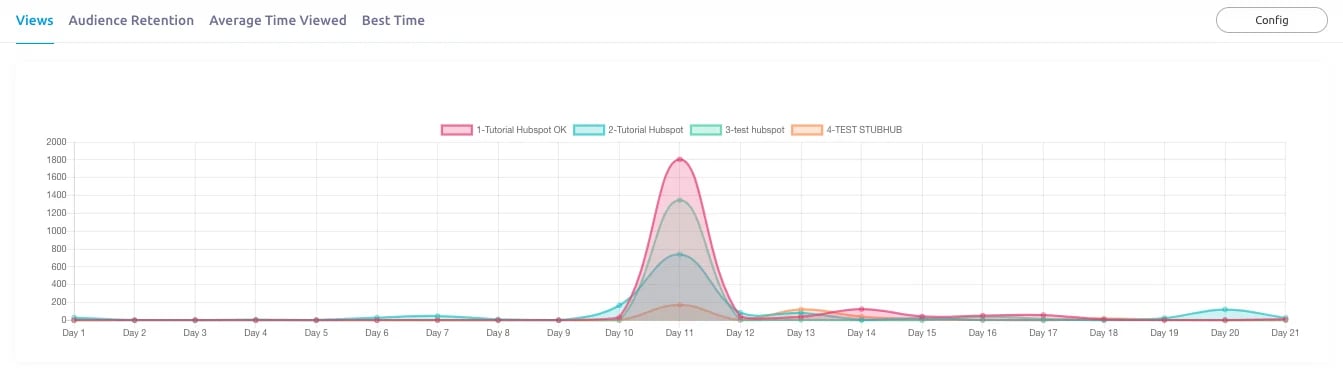
Views represent the number of times your videos have been watched. This metric is important because it shows whether your users have found your campaign engaging enough to view your content.
Las visualizaciones representan la cantidad de ocasiones en las que tus vídeos han sido vistos. Está metrica es importante porque te muestra si tus usuarios han encontrado tu campaña lo suficientemente atractiva como para ver tu contenido.
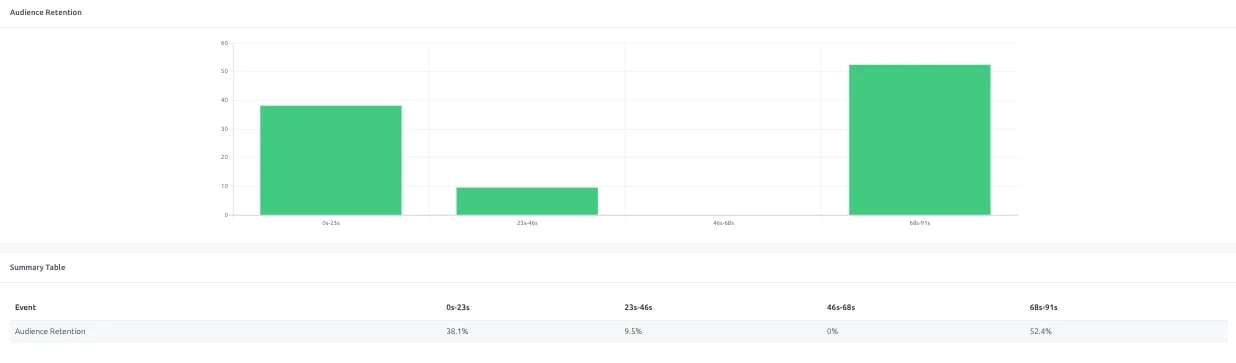
2.2 Audience Retention
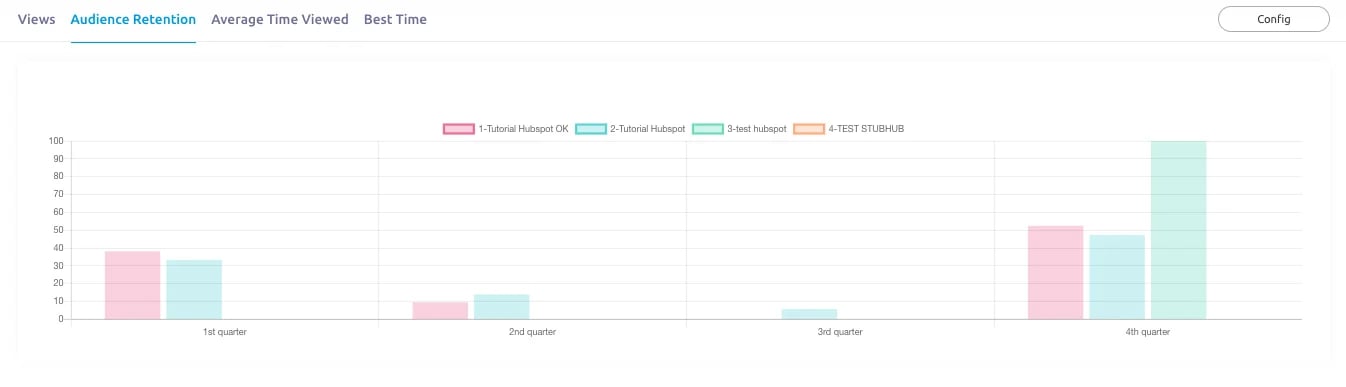
Once your subscribers have clicked on the email video and watched it in its entirety on the web environment, our platform gathers information about the video segments that generate interest among the audience and at what points they tend to stop watching.
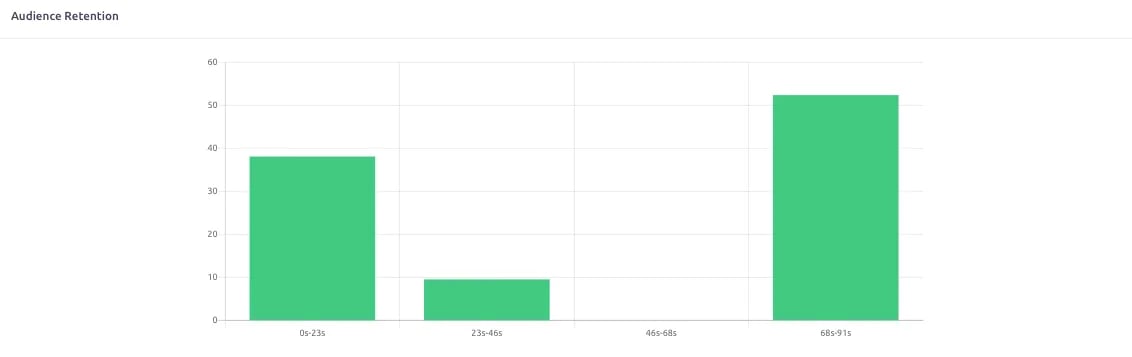
Identifying the moments when audience retention decreases will allow you to adjust and optimize those parts of the video, thus maintaining the attention and engagement of your viewers throughout the playback.
2.3 Average Time Viewed
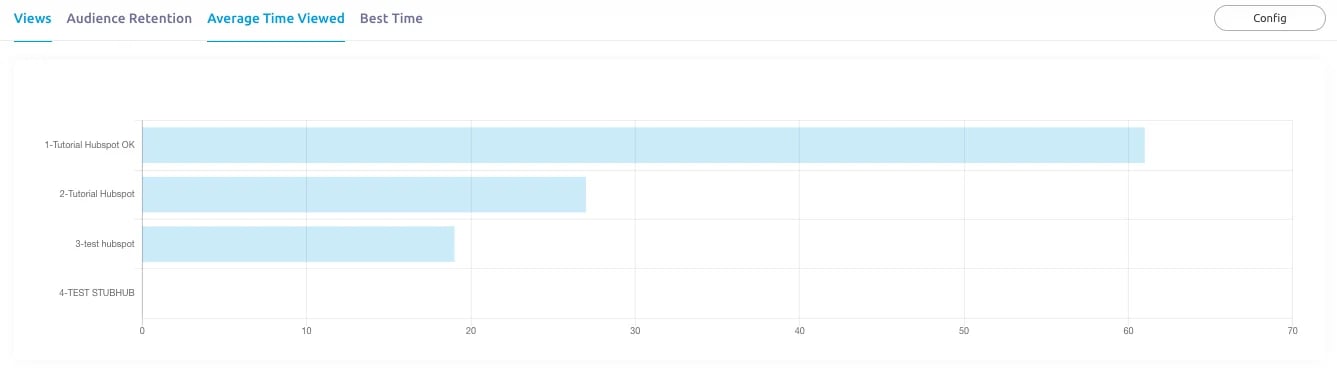
The ATV (Average Time Viewed) is the average number of seconds that your subscribers have watched your video. For example, if your video is 40 seconds long, your subscribers may only watch an average of the first 20 or 35 seconds.
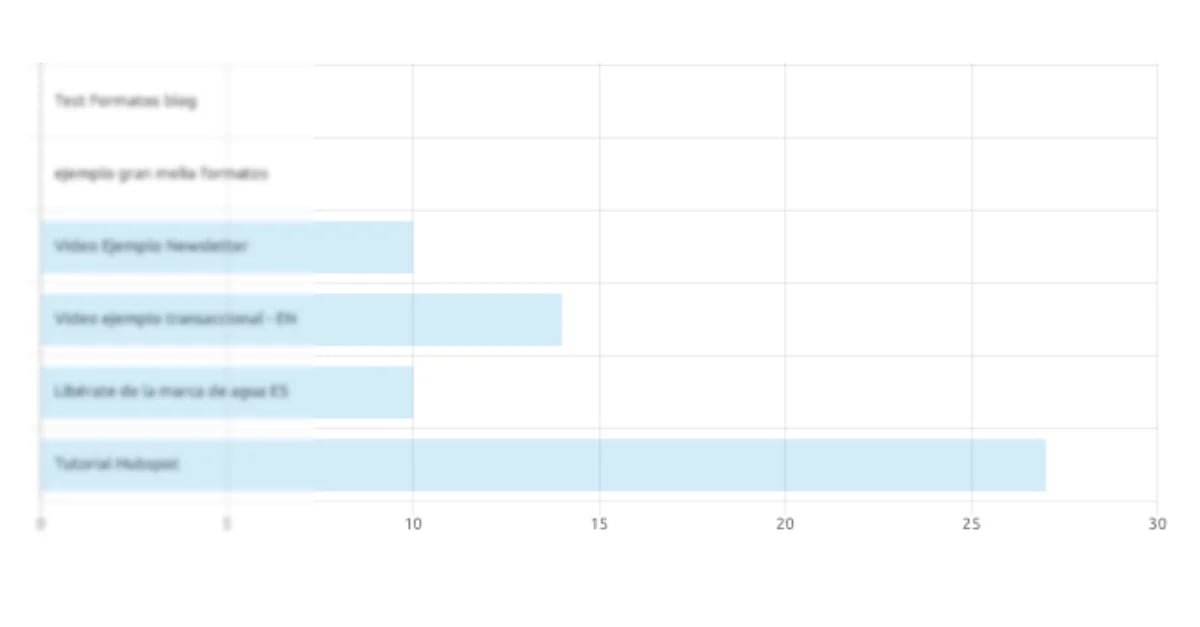
Additionally, the ATV can help you determine the appropriate duration for your future videos.
2.4 Interaction
In this report, you will get a detailed breakdown of the actions taken in each section of the video, including pause (1), resume (2), skip (3), rewind (4), mute (5), unmute (6), fullscreen (7), and exit fullscreen (8). Our platform divides the video duration into four equal time intervals (Q1, Q2, Q3, and Q4), which means that if the video is 40 seconds long, you will see four sections of 10 seconds each.
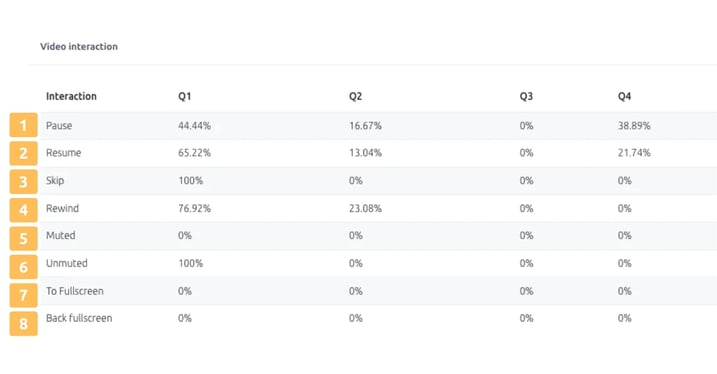
This information will allow you to analyze the level of interest and interaction generated by your video in each of these specific sections. You will be able to identify how viewers interact with your content over time and understand the actions they take at different key moments of the video.
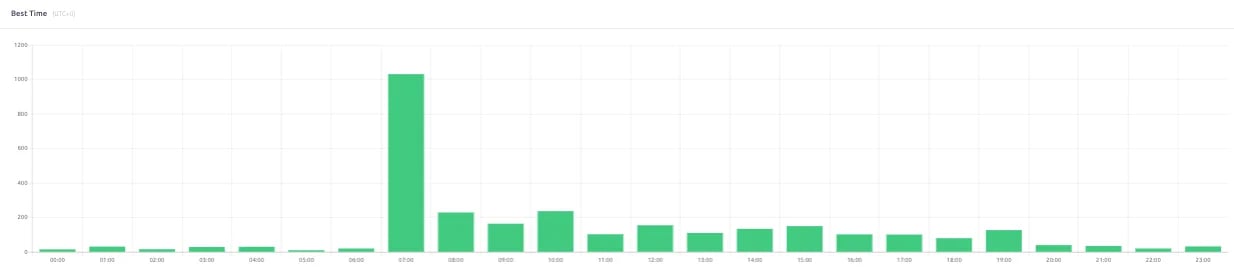
2.5 Best time
Unlike YouTube, where it takes time to index and display the video on the homepage or search results, in email marketing, the video is viewed when the user opens the email. This means that for success in your future campaigns, you should consider the time when most of your users watch your videos, as well as the delivery time of your emails by your email marketing platform. By doing so, you will maximize the chances of capturing your subscribers' attention and achieving better results in your email marketing campaigns.
For example, if your emailing platform takes 60 minutes to complete sending emails to your entire database, and our report indicates that the most favorable time slot for your videos to be viewed is between 4:00 PM and 7:00 PM, it is ideal to send your campaign starting from 3:00 PM.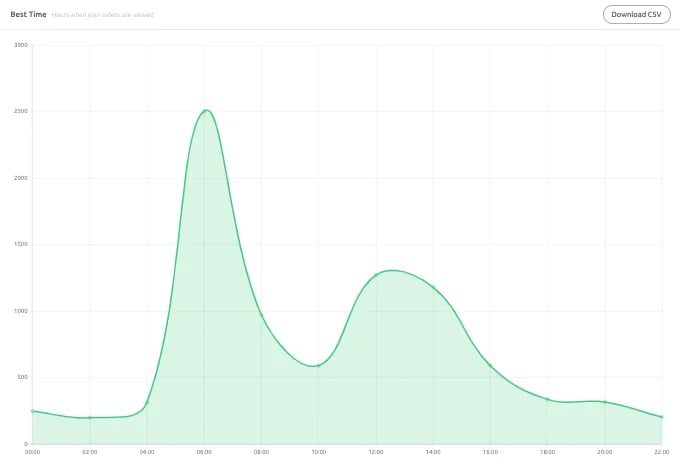
3. How to access the statistics suites
We have developed two statistics suites: Global Statistics and Advanced Real-Time Statistics. Accessing any of these panels is very simple, you just need to click on "Statistics" in the left menu of your account and select the suite you want to review.
Hemos desarrollado dos suites de estadísticas: Global Statistics y Advanced Real-Time Statistics. Acceder a cualquiera de estos paneles es muy sencillo, solo debes hacer clic en "Statistics" en el menú izquierdo de tu cuenta y seleccionar la suite que deseas revisar.
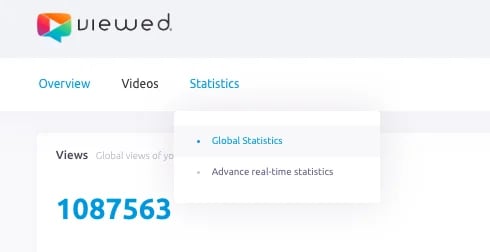
The Global Statistics panel is available in all plans of our platform, including the Free Plan. However, if you need more advanced information for each video, we recommend upgrading to the Professional or Enterprise license. These licenses will provide you with greater control over your campaigns and access to more detailed reports.
If you would like to learn more about our plans, you can schedule a video call with our sales team.
4. Global Statistics Suite
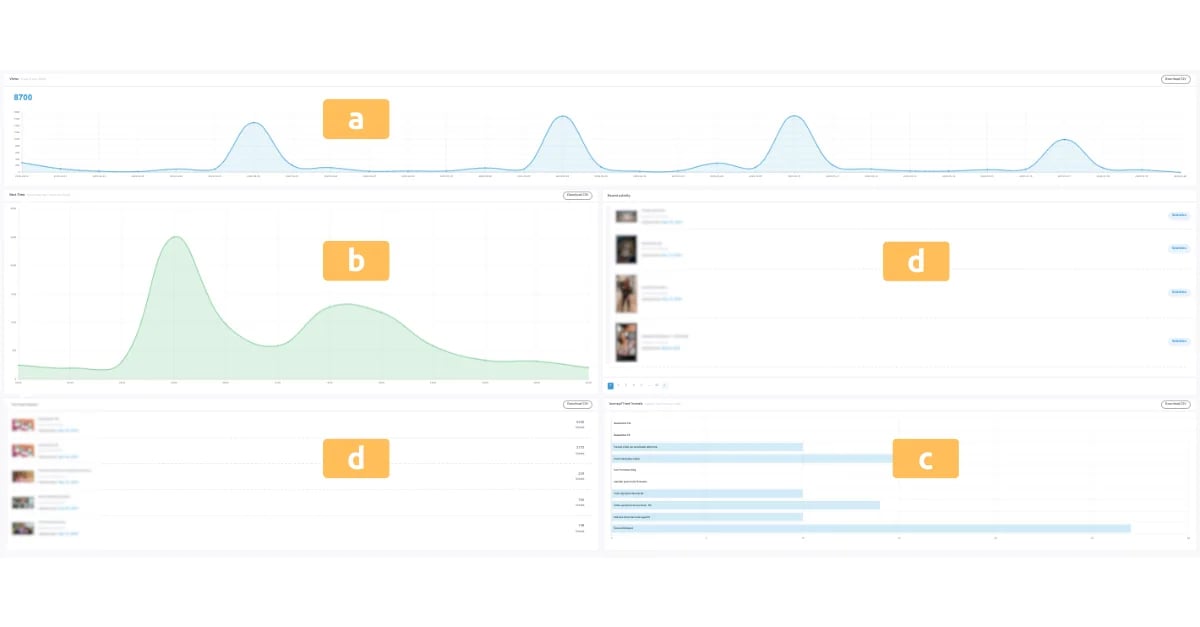
The Global Statistics Suite is a user-friendly tool that provides you with an overview of your hosted videos. From this panel, you can easily manage and analyze your statistics.
In this suite, you will find the following reports:
- Views: displays the total number of views for all your hosted videos.
- Best Time: shows the hours with the highest number of views based on information from all your videos.
- ATV (Average Time Viewed): allows you to see the average duration that viewers have watched from your 5 most recent videos.
- Recent Activity and The Most Viewed: finally, we have these two reports exclusive to PRO accounts that provide you with information about the total number of views for your recent hosted videos and the most viewed videos, respectively.
5. Advanced Statistics Suite
The Advanced Statistics Suite allows you to track the performance of your videos. From here, you can view the results of each video and compare up to 4 campaigns at the same time.
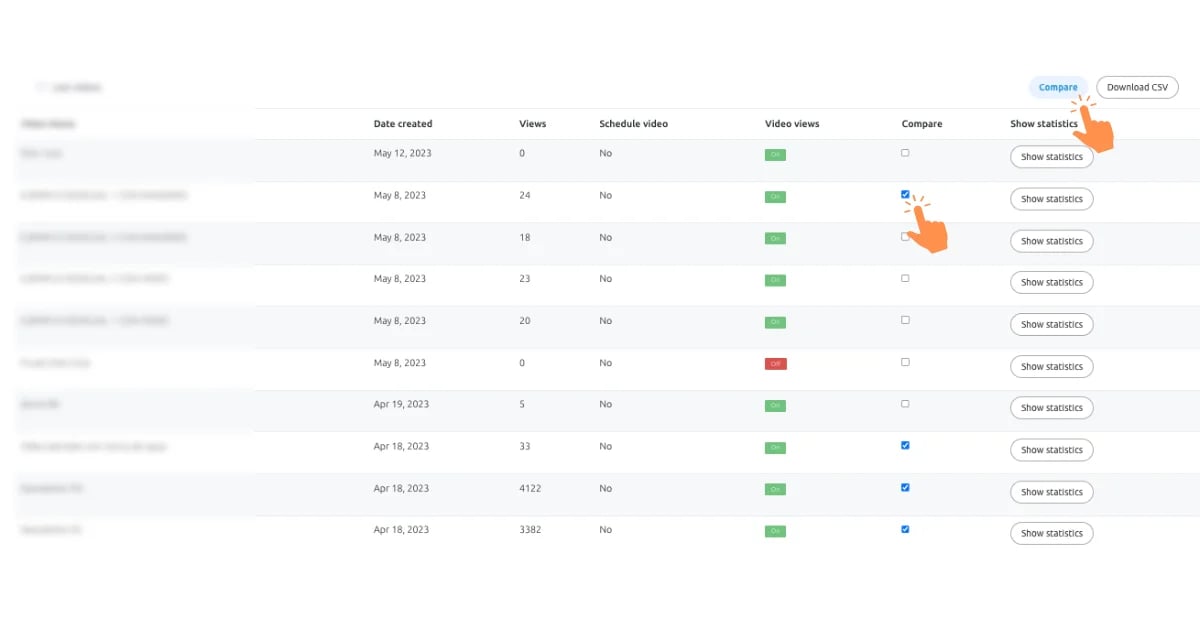
On the first page, you will find a list of all your videos with basic information for each, such as the name (1), the hosting date (2), the number of views (3), whether the video has been scheduled to be viewed within a specific time period (4), and if the viewing is active for your subscribers (5).
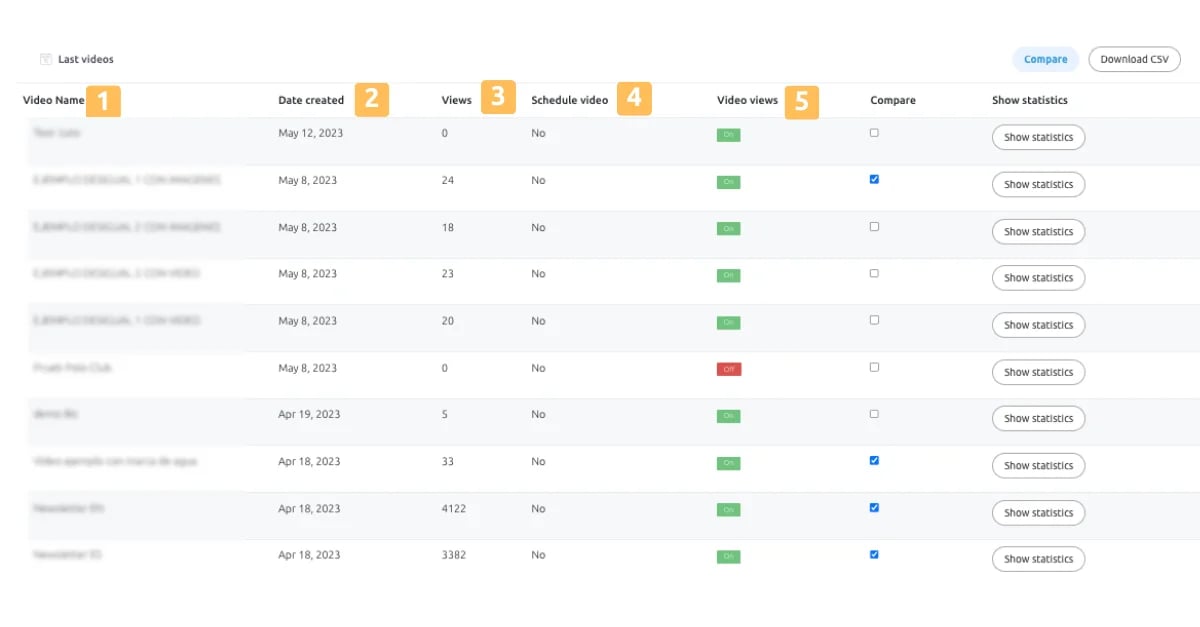
To locate the video you want to analyze, you have three options: you can directly search for it in the list, type the name in the search field, or select the date it was uploaded to our platform.

In this suite, you have access to individual statistical reports for each video, as well as group reports to compare performance across different videos. Additionally, you also have the option to download the information in .csv format for analysis outside of our platform.

5.1. Individual Statistics Panel
To view advanced reports for your videos individually, simply click on the "Show statistics" button of the video you wish to analyze.
.png?width=1200&height=273&name=Tutoriales-%20Foto%20destacada%20%20(6).png) Next, you will be directed to the statistics panel of the selected video, where you will see a small left sidebar menu with the following reports:
Next, you will be directed to the statistics panel of the selected video, where you will see a small left sidebar menu with the following reports:
Views
Unlike the report in the Global Statistics suite, this section exclusively shows you the number of views for the video you are reviewing.
Interaction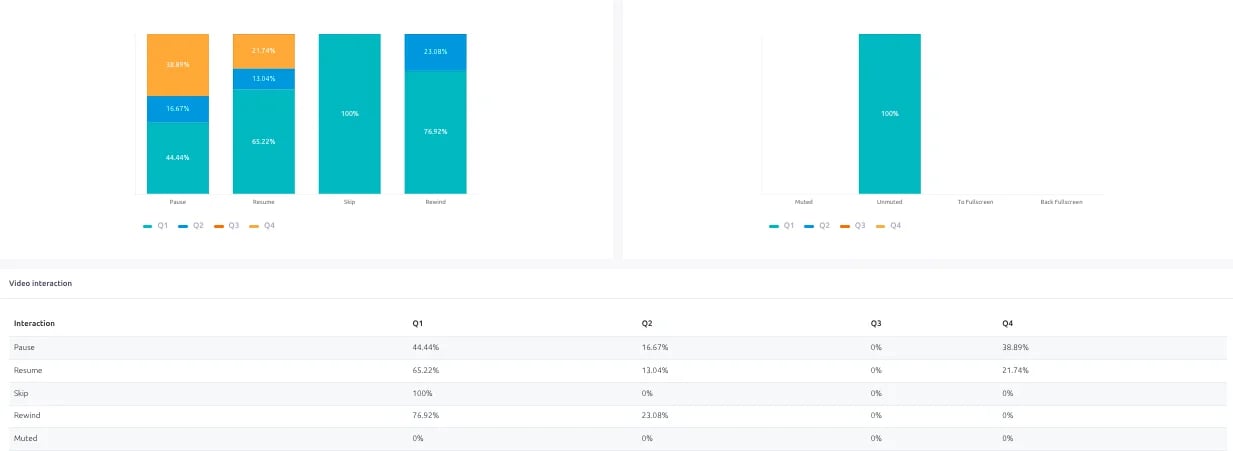
Audience Retention
Best Time
5.2. NEW Feature: Performance Comparison
Knowing the performance of each video is not enough; you also need to be able to compare the results between 2 or more videos, especially when running A/B tests.
In our advanced statistics panel, you can select up to 4 videos and view the results in a single graph. To do this, you need to mark the videos you want to compare in the "Compare" column and click the "Compare" button located at the top of the table. Please note that you can only compare videos that have generated views.
Conocer el rendimiento de cada vídeo no es suficiente, también necesitas poder comparar los resultados entre 2 o más vídeos, sobre todo cuando lanzas Test A/B.
En nuestro panel de estadísticas avanzadas podrás seleccionar hasta 4 vídeos y visualizar los resultados en un mismo gráfico. Para ello debes marcar los vídeos que deseas comparar en la columna "Compare" y dar clic en el botón "Compare" que se encuentra en la parte superior de la tabla. Ten en cuenta que solo podrás comparar vídeos que ya hayan generado visualizaciones.
As in the individual statistics, you will also see the following reports in the comparative statistics:
Views
Audience Retention
Average Time Viewed
Best Time
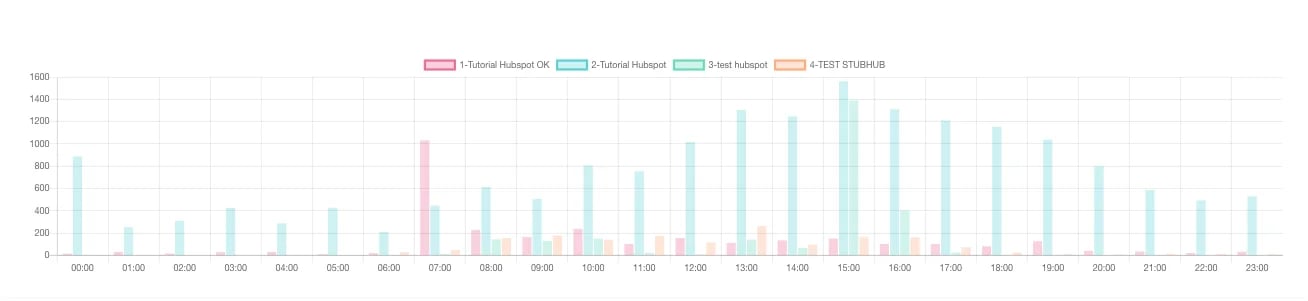
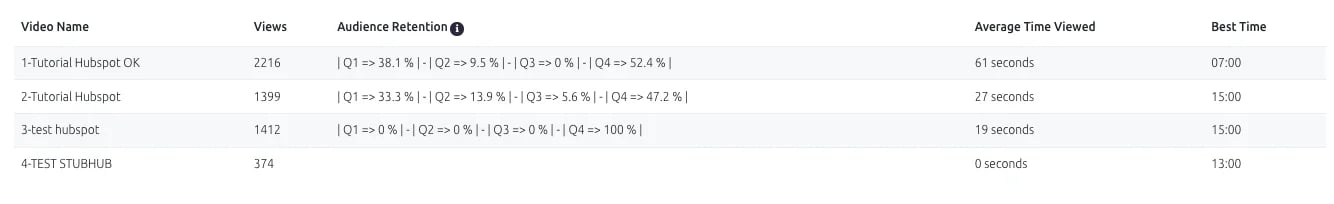
In addition to the graphs for each report, you also have a table that summarizes the statistical information of the selected videos.
To conclude, we understand that videos are not always sent via email within the same time frame, except for A/B tests. That's why we have included an option that allows you to select the time period you want to analyze for each video. Simply click on the "Config" button and set the dates and the range of days. 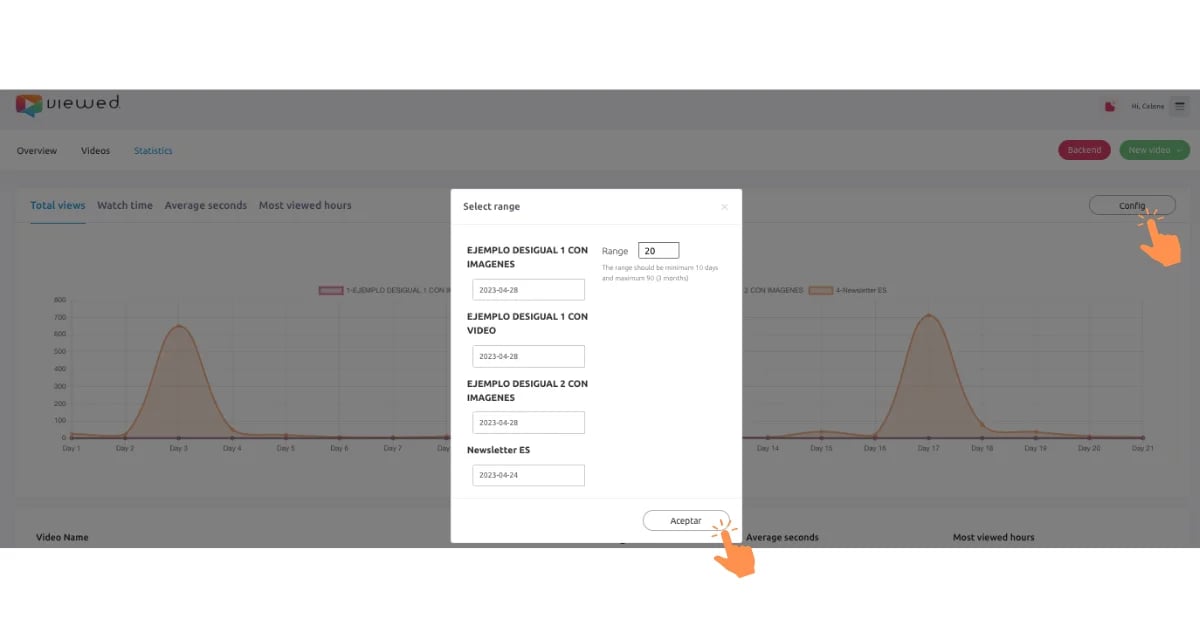 Take advantage of Viewed statistics and take your email marketing strategy to the next level. Discover the real impact of your videos on your audience and make data-driven decisions.
Improve the effectiveness of your campaigns and maximize the potential of your emails with Viewed. If you want to learn more about our platform, feel free to schedule a video call with our team of email marketing experts.


.png)